FIEO Analysis of Exports Trend
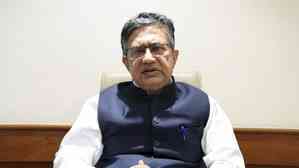
Author(s): City Air NewsMr Ganesh Kr Gupta, President, FIEO (second from right) addressing the media during FIEO Press Meet at New Delhi on May 25, 2017. Also seen in the picture is Mr Nari Kalwani, Regional Chairman, FIEO (ER) to the...
 cityairnews
May 25, 2017 12:30
0
cityairnews
May 25, 2017 12:30
0


Mr Ganesh Kr Gupta, President, FIEO (second from right) addressing the media during FIEO Press Meet at New Delhi on May 25, 2017. Also seen in the picture is Mr Nari Kalwani, Regional Chairman, FIEO (ER) to the left of Mr Gutpa and on his right is Mr Ajay Sahai, DG & CEO, FIEO along with Mr Khalid Khan, Regional Chairman, FIEO (WR).
New Delhi, may 25, 2107: India has huge potential in exports which needs to be exploited by entrepreneurs through productivity, quality and competitiveness. We are providing a gist of our findings based on India’s exports in 2016 (calendar year) as well as global imports in 2016 as detailed below:-
Out of about 5800 products at 6 digit ITC(HS), 200 top products, at 6 digit, contribute to about 58% of global imports. These top 200 products at 6 digit also account for 50% of India’s exports. Therefore, at an aggregate level, India’s exports are in sync with global trends in imports. However, India’s share in global imports for top 200 products stood at 1.43% as against India’s overall share of 1.62% in 2016 (the list of 200 products is attached as Annexure-A). This shows that we have good potential to increase our exports, if we push our exports in these top 200 tariff lines.
A further disaggregation of top 200 products show that in respect of 119 tariff lines, India’s exports are constantly moving up, on the base of 2006, both in 2011 and 2016. Please find attached the list of such products which has been rearranged, based on India’s share in 2016, in a descending order, as can been seen as Annexure-B.
There are 20 tariff lines in which India’s share in 2011 declined, on the base of 2006, but it grew in 2016. The list of products, based on India’s share in 2016, is attached as Annexure-C.
However, in respect of 49 tariff lines where India’s share increased in 2011, we witnessed a decline in 2016. The list of such products, based on India’s share in 20016, is attached as Annexure-D.
There are 12 items at 6 digit level (Annexure-E) in which India’s share is constantly shrinking as reflected in the figure of 2011 & 2016 respectively.
The aforesaid broad analysis can provide a basis to support those products where India’s share is increasing particularly where the exports are also increasing in value terms. For example, in Knitted T-shirts (other than cotton), India increased its exports by USD 728 million between 2011-16 and its share in global imports went up by 4.5%. More promising are those products where despite increase in value-wise exports between 2011-16, we lost market share as it shows that our export growth is not coping with increase in world demand for the product. In automobile segment (HS Code-870321), our exports grew by about USD 100 million between 2011-16 but we lost the market share by over 3%. Same is the case with handbags (HS Code-420221) in which India’s exports grew by USD 50 million in the same period but we lost market share by 0.5%. These two categories of the cases could be looked more closely to provide some support for accelerating our export further.
Equally relevant would be the task to understand why we are losing our share in respect of 61 tariff lines. Some of these tariff lines for example, 880330 like parts of aeroplanes and helicopters are important to showcase India’s growing prowess in manufacturing.